Waterfall Chart – Visualizing accident data with Power BI

Bar Charts and Slicers for Year over Year Analysis – Power BI
January 15, 2024Waterfall Chart – Visualizing accident data with Power BI
0:00 Intro
0:12 Dataset introduction
1:16 Loading data from Excel to Power BI
2:51 Line Charts
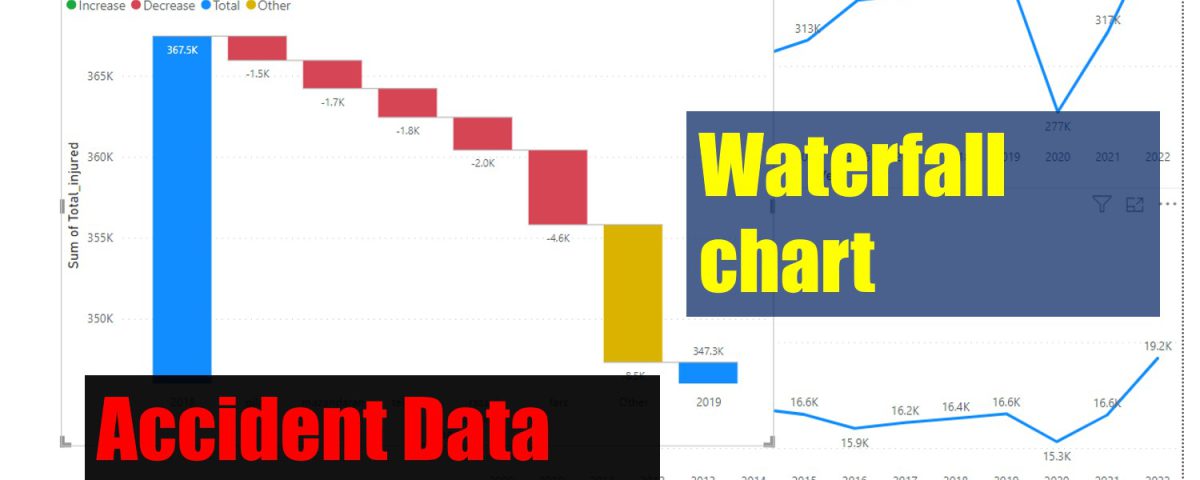
7:03 Waterfall Charts
We use line charts and waterfall charts in Power BI in this video to visualize accident data of 14 year (from 2009 to 2022) of a country.
Hamid Moradi
Micromobility Expert and Data Analyst