Hamid Moradi
January 22, 2024

The newspaper Donya-e-Eqtesad held a conference on energy economics in the construction industry on July 15, 2011. The conference focus was on energy efficiency in the three areas of design, construction, and operation. The conference were being held in line with the government’s subsidy reform plan, the goal of which is to encourage energy conservation and reduce household costs. The conference featured the following topics: Following the Economy of Energy […]
January 22, 2024
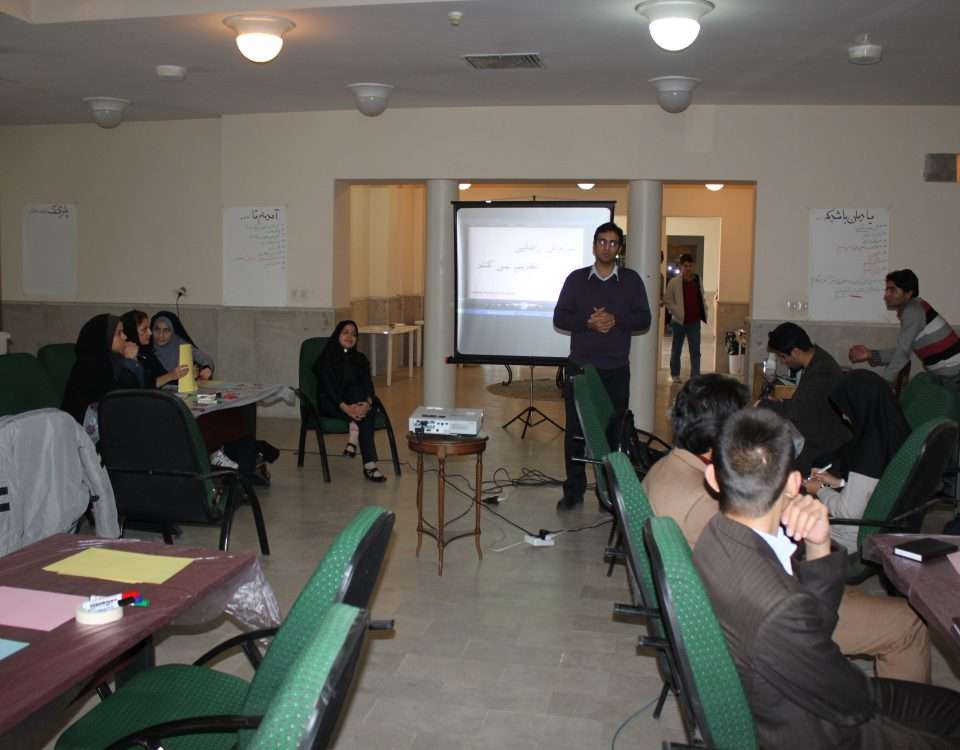
This workshop on “Features of a Desired Scientific Association” was held at IKIU in October 2011. It was a collaborative effort between the IKIU Office of Scientific Association and the Ministry of Science Research and Technology. At the time, Hamid Moradi served as the Deputy of the Scientific Association and was also one of the workshop presenters.
January 15, 2024

I put the codes related to cleaning the trip data of yellow taxi of New York. So it is about data cleaning. About Dataset Yellow taxi trip records include fields capturing pick-up and drop-off dates/times, pick-up and drop-off locations, trip distances, itemized fares, rate types, payment types, and driver-reported passenger counts. The data used in the attached datasets were collected and provided to the NYC Taxi and Limousine Commission (TLC) […]
January 15, 2024

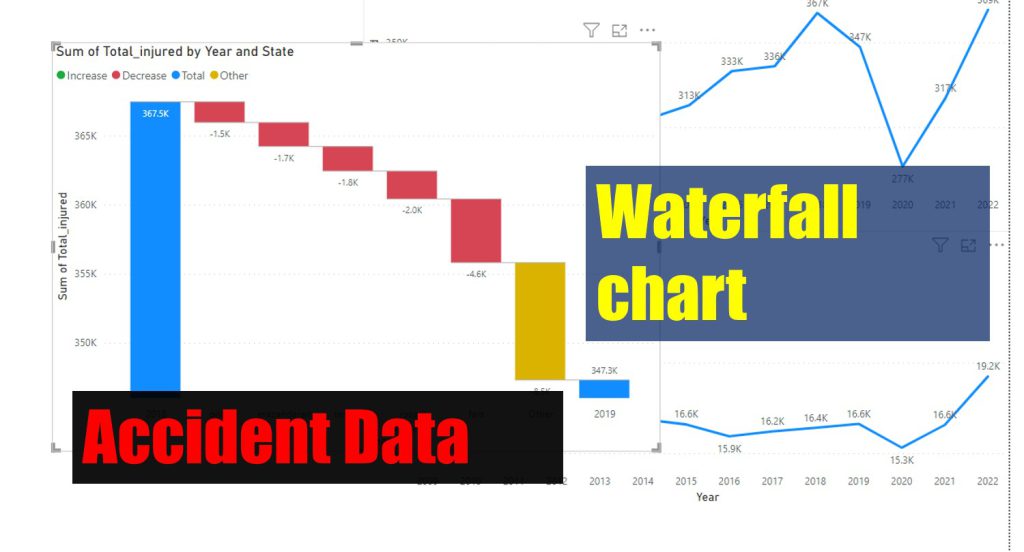
We have a dataset of 14 years of data including injured and dead people in traffic accidents in Iran. we want to know the provinces that had the most increase or decrease number of dead or injured people compared to last year. We get help from power BI features like bar charts, Slicer and Quick Measure (Year over Year Change – YOY%) In this video, I’ll show you how to […]
January 15, 2024
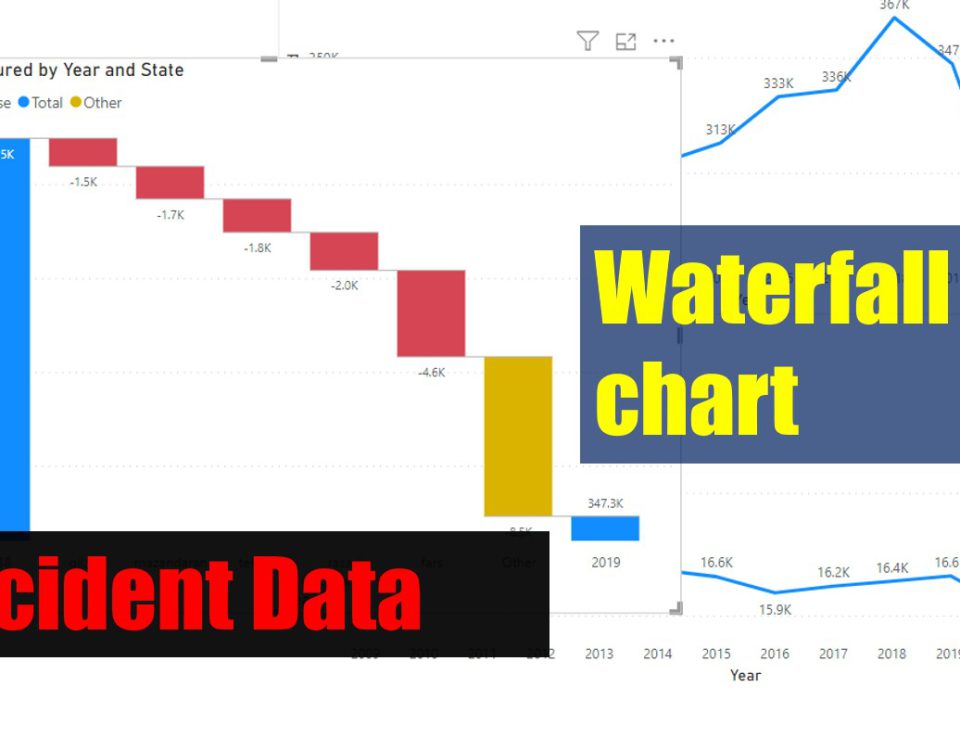
0:00 Intro 0:12 Dataset introduction 1:16 Loading data from Excel to Power BI 2:51 Line Charts 7:03 Waterfall Charts We use line charts and waterfall charts in Power BI in this video to visualize accident data of 14 year (from 2009 to 2022) of a country.
June 25, 2021

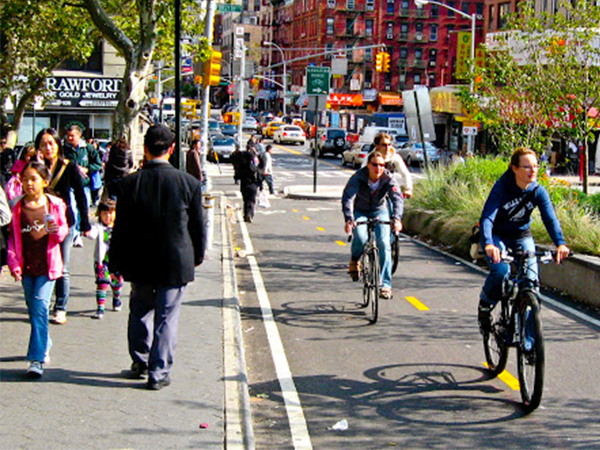
it became harder to cycle in the city every year. The growing number of cars were a serious problem. Taxi drivers’ speeding was dangerous and after involving in near crash accidents several times, I gave up cycling.
November 1, 2020

“Citizen Jane, Battle for the City” film is about the city development. The modern history of New York in urbanism.It shows Jane Jacobs’ efforts against Robert Moses projects. The main role in this history is Robert Moses. He was not an actor but many kind of changes that you see now in the city of New York is because of him. Towers, parks and highways are the legacy of his […]
September 16, 2014
Urban development is the key factor for a cycling city. Based on Lucas Harms article, urban cycling increased in urban areas in some parts of Netherlands[2]. This fact is opposite of what we know about many cities around the world. One reason for this increase can be better urban planning and special attention to bicycle as means of transportation in the process of urban development in Netherlands.